


Why Climate Change May Mean Less Frequent Extreme Temperatures

A narrative of climate change is that the radiative forcing of carbon dioxide will mean more frequent extreme temperatures. As a ‘what-if?’ investigation, I selected the dates of the maximal and minimal temperatures for HCN stations nearest to the CONUS based RAOB stations for the year 2023. For the RAOB soundings, I ran the ‘Column Radiation Model’ (CRM) considering the effect of changing carbon dioxide for the given sounding from ‘pre-industrial’ to two times ‘pre-industrial’. An example of the result is in this figure for Topeka, KS
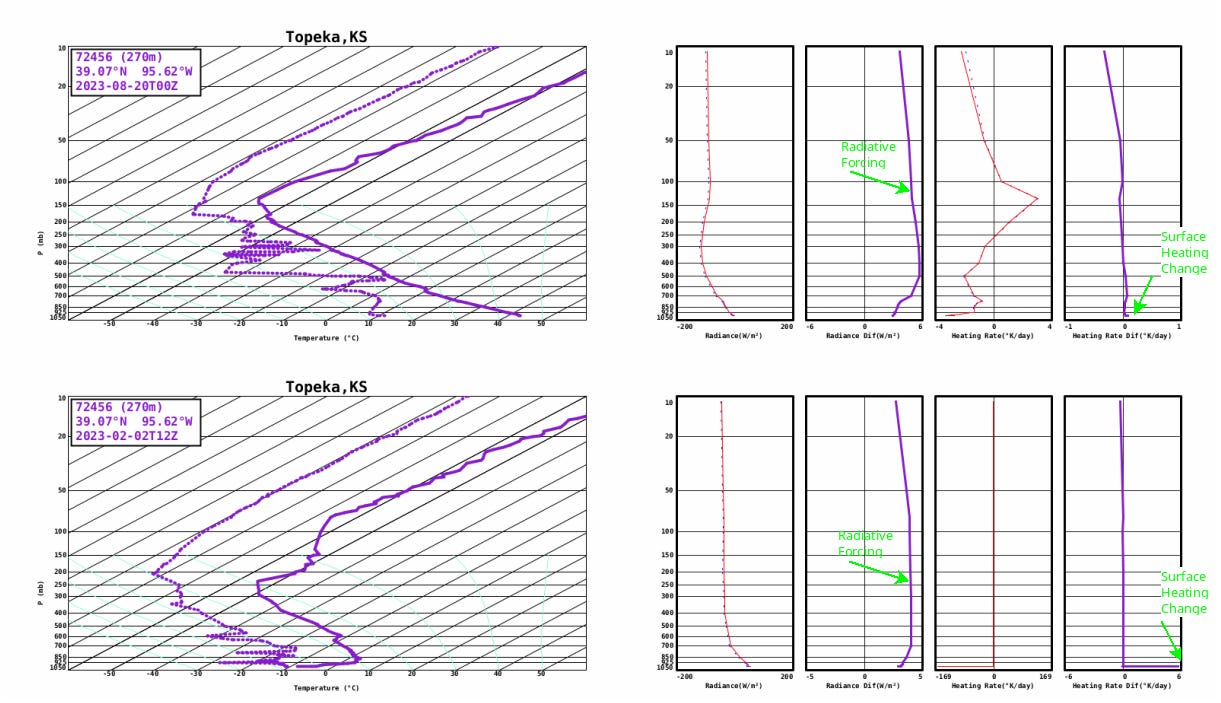
The top sounding is the 00Z sounding following the hottest day. The bottom sounding is the 12Z sounding after the coldest night. In this instance, the change of surface heating for the hottest day remains close to zero, while the change of surface heating for the coldest night is quite large. It is important to distinguish surface heating from the change in radiance ( all labeled in green ). Surface considerations are not part of figuring long term changes in global mean, but they are significant on short term, such as occurs during extreme temperature events.
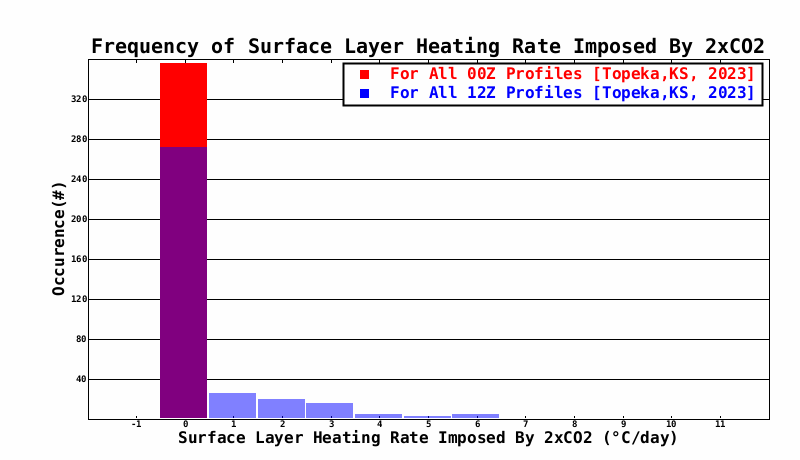
A plot of the frequency of surface heating rates imposed by doubling CO2 for all available extreme temperature soundings yields the following:

The heating rates for 2xCO2 @maximal temperature soundings are all clustered around zero. Most of the minimal temperature soundings are also near zero, but a portion exhibit much higher heating rate changes.
Considering all the 2023 soundings for a given station(Topeka KS), yields a similar pattern. For most soundings, the effect on surface heating rate of doubling CO2 is near zero, but for a small portion of the morning soundings only, this effect can be large:
When plotted against some available measures, the distinction between morning and evening soundings is apparent. There appears to be some relationship with precipitable water and morning soundings ( which tend to have an inversion at the surface ). The fact that evening soundings do not exhibit the same relationship suggests other factors are more important. Also depicted is the relationship between the lapse rate of the lowest layer. A combination of inversion intensity, inversion depth, total water vapor, distribution of water vapor.
Distinction
The effect of surface heating rate is different from global warming.
Global warming is a manifestation of the radiative forcing at the tropopause, and so, a reflection of the heating rate of the troposphere. The surface heating rate change is for the lowest layer, with the bottom being 2m above ground. The concept of increased extreme maximum temperature arises from belief that such events arise from the global mean temperature increase. The effects of surface heating rate are local and near term.
This raises the question about the relationship of mean global temperature and local extreme temperatures. Clearly, other factors: Arctic air mass intrusions, dynamic fluctuation of humidity, clouds, can effect minimum temperatures. Also, stagnant high pressure areas, low prior precipitation, can determine extreme maximum temperatures.
Also, morning soundings can have quite steep radiative inversions, including those below the 2 meter ‘surface’ level, so there is some observation bias in that these features are not captured by measurements.
At the least, changes to surface heating rate for the atmospheric profiles currently observed, tend to limit some extreme minimum temperatures and have little effect on extreme maximum temperatures.
National Center for Atmospheric Research, “Column Radiation Model,” from the NCAR Community Climate Model 3, model code downloaded from: http://geosci.uchicago.edu/~rtp1/PrinciplesPlanetaryClimate/Courseware/PlanetaryClimateCourseware/CliMT-master/src/radiation/ccm3/ignore/crm-2.1.2-ccm-3.6/doc/index.shtml
RAOB soundings accessed at: https://weather.uwyo.edu/upperair/sounding.html
HCN surface observations.
Menne, M.J., I. Durre, B. Korzeniewski, S. McNeill, K. Thomas, X. Yin, S. Anthony, R. Ray, R.S. Vose, B.E.Gleason, and T.G. Houston, "Global Historical Climatology Network - Daily (GHCN-Daily)", Version 3.30. NOAA National Climatic Data Center. http://doi.org/10.7289/V5D21VHZ, accessed March 3, 2024.