Introduction
Climate models of atmospheric response to increased carbon dioxide represent complex interdependent processes. However, because processes within the atmosphere can and do vary independently of carbon dioxide, independent observations of parameter changes, predicted by climate models, more closely represent case studies than validation of controlled experiments. Professor Syukuro Manabe has described the value of assessing climate model predictions qualitatively.
Below are comparisons of past NASA GISS Model E runs of increased radiative forcing, displayed as spatial parameter change profiles at pressure levels versus latitude. The figures below are produced from the graphical output of the model runs and from applying the same scaled color palettes to the changes of observations and reanalysis from the ordinary least squares fits.
Model
The model runs are for the “A1B” scenario, which was a mid-range greenhouse gas forcing scenario. The reader can examine other scenarios and other periods to observe that the qualitative distributions of parameter change appear to occur in a similar way for other scenarios and also for both past and future time spans.
Time
The periods of consideration are defined as the RAOB Era (1958-present), the MSU Era (1979-present) and the Twenty-first century (2001-present). The analysis extends through 2020 which marks the latest available complete year.
Reanalysis
The reanalysis changes are calculated from the ECMWF ReAnalysis (ERA5), quarter degree monthly means. This recent reanalysis is of relatively high resolution and contains the high performing ECMWF data assimilation routines. Unfamiliar readers should understand that reanalysis does not strictly represent observational data. Reanalysis assimilates sparse observations and then executes short term prediction algorithms in a so called model spin-up to provide physically consistent high resolution estimates for areas where no data is available. Because of this, reanalyses are not strictly falsifiable. Also, reanalysis includes parameterizations of processes which may be quite similar to the parameterizations within climate models. Any bias introduced from these common parameterizations may then artificially introduce similarity in the results of the models and the reanalysis.
Radiosonde Observations (RAOBs)
The RAOB data is from the Integrated Global Radiosonde Archive (IGRA) V2 data set (0Z only). RAOBs represent the “weather balloon” data. Weather balloons carry instruments aloft which radio back observations to receivers at weather stations. In contrast to reanalysis, these data are direct observations. But these observations are sparse. Also instruments around the world have been non-uniform with changes over time. These and other factors introduce uncertainty in the RAOB data.
Microwave Sounding Unit (MSU) Data
The final data sets are those estimated from satellites carrying the Microwave Sounding Units. Two different analyses are from Remote Sensing Systems (RSS) and the University of Alabama at Huntsville (UAH). These analyses estimate temperature based on the emissions of microwaves from oxygen atoms within layers of the atmosphere. These data cover much of the earth, however the estimates are coarse in the vertical and contain numerous uncertainties. There are uncertainties with all the available comparison data sets.
Parameters
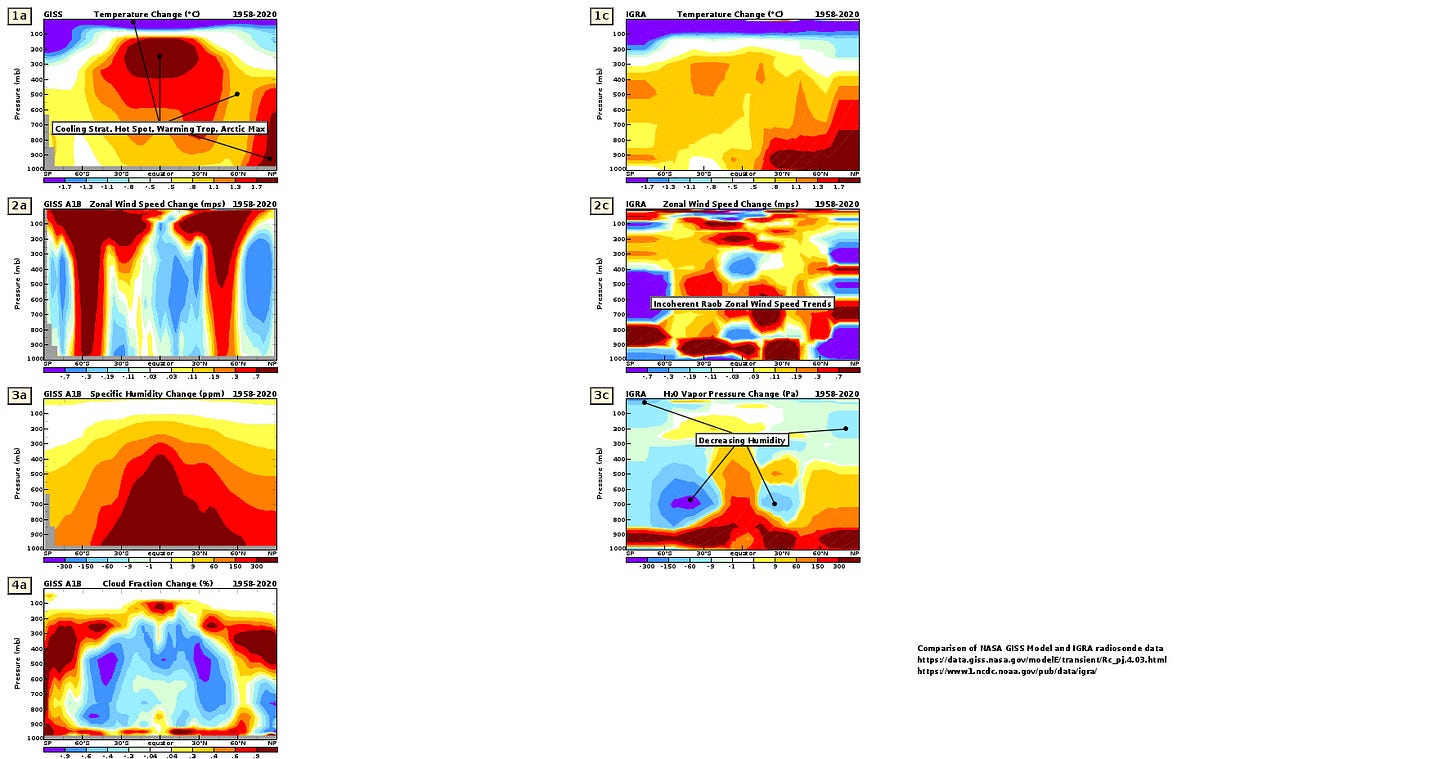
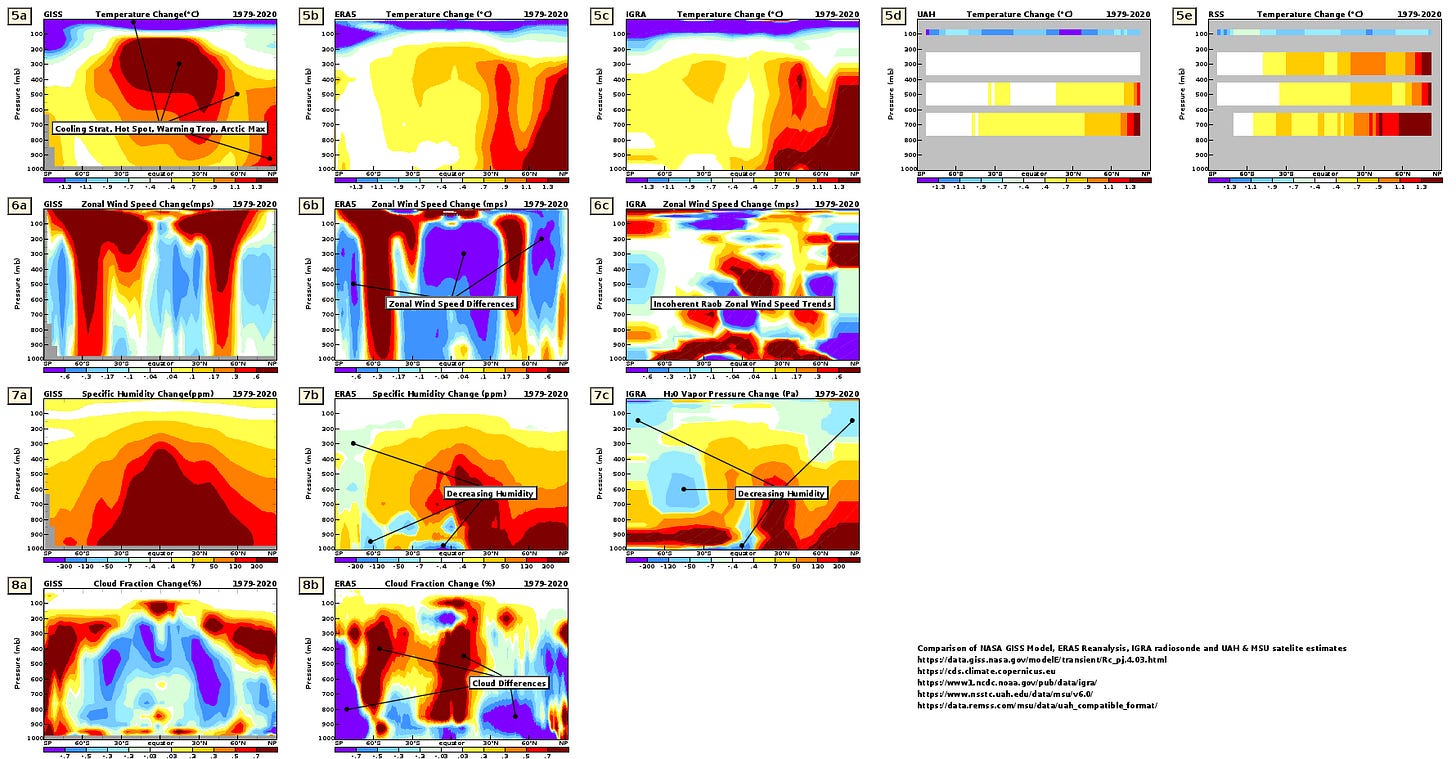
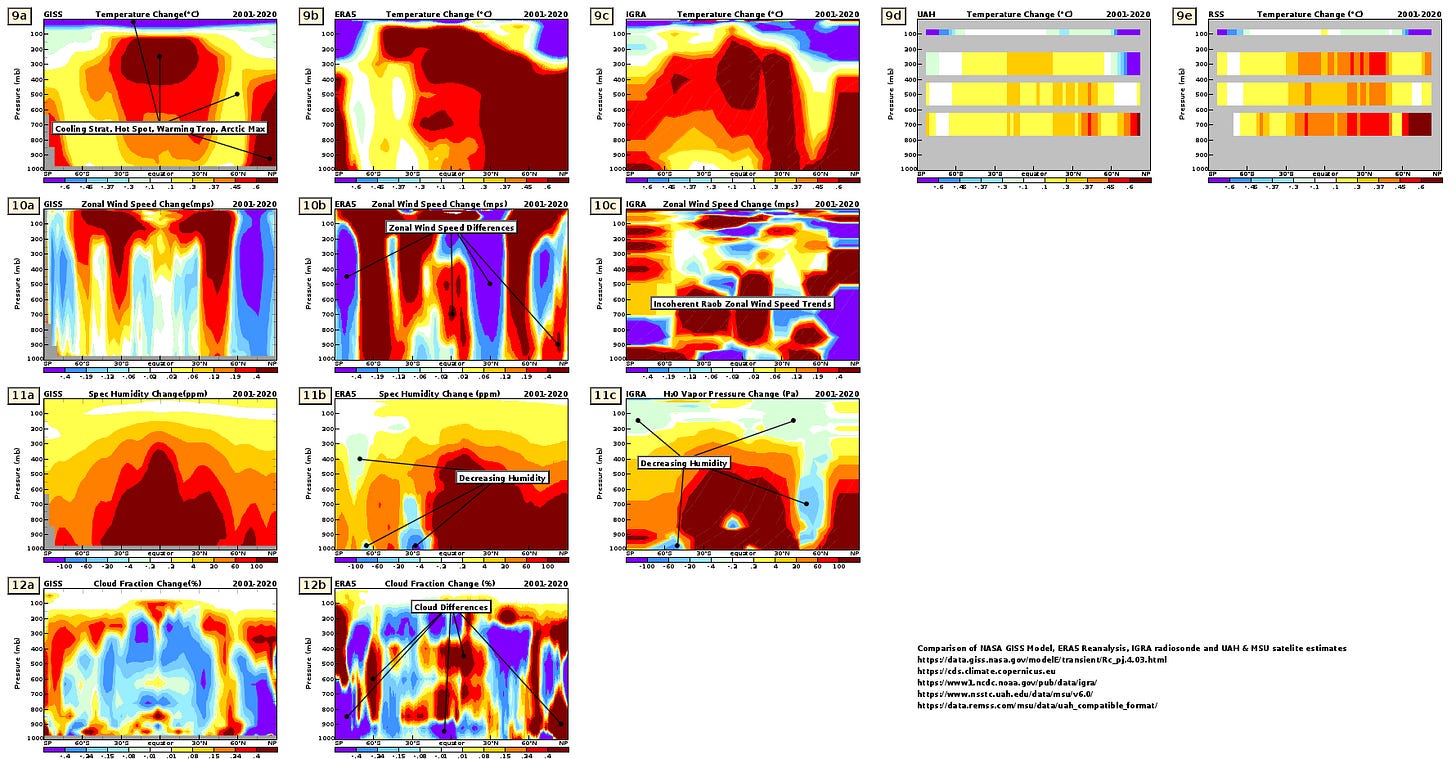
In the figures below, the first row contains plots of temperature change for the time period indicated. The second row contains plots of zonal wind speed change. The ‘zonal wind’ represents only the component of a wind vector blowing along an east-west axis. The third row contains plots of humidity change and the fourth row contains plots of cloud fraction change.
Climate Changes of the RAOB Era

Figures of column ‘a’ above represent the changes of modeled forecasts for the period 1958 through 2020 and figures of column ‘c’ above represent the changes of parameters from RAOB data.
In figure 1a, the labels indicate four model predicted changes of temperature distribution of note. Temperatures at the stratosphere are modeled to decrease, and this feature is broadly consistent with RAOB trends of figure 1c. In figure 1a, a Hot Spot of maximal warming is modeled to occur, but this feature is not apparent in the RAOB trends of figure 1c. In figure 1a, temperatures of the troposphere are modeled to increase everywhere, which is consistent with RAOB trends of figure 1c. Finally, in figure 1a, temperatures over the Arctic are modeled to exhibit a maxima of increase, which is also consistent with RAOB trends of figure 1c.
Figure 2a indicates two “t-bone” shaped areas of increased zonal wind speed at roughly 55°S and 50°N and decreases of zonal wind speed elsewhere. The RAOB zonal wind speed band averages in figure 2c do not appear to indicate any coherent trends. This is perhaps an expected result as RAOB stations are sparse and may not capture the spatial distribution of zonal wind speed changes.
The modeled humidity changes of figure 3a indicate a triangular shape of increased humidity maximal near the surface and near the equator. Also, modeled changes indicate no areas of significant humidity decrease. In contrast, the RAOB data indicate significant large areas of decreasing humidity. Humidity is notoriously difficult to measure and instruments have changed since 1958. However, this discrepancy partially contradicts modeled humidity response.
The modeled cloud changes depicted in figure 4a are marked by increased very high clouds and very low clouds at all latitudes and decreased mid-level cloudiness for most latitudes. This parameter is not directly available from RAOB data.
Climate Changes of the MSU Era

For the MSU era, the major modeled change features of figures 5a through 8a are quite similar to those of the RAOB era in figures 1a through 4a. In addition to the RAOB data, this period of analysis includes reanalysis in column b and MSU data in columns d and e. The reanalysis, the RAOB data and the MSU data all tend to corroborate the model changes of decreasing stratospheric temperature, increasing tropospheric temperature, and a maxima of temperature increase over the Arctic. The reanalysis, the RAOB data and the MSU data all tend to contradict the modeled temperature changes of the Hot Spot area.
The zonal wind speed changes calculated from band averages of the RAOB data appear to be incoherent as they were from the earlier era. The zonal wind speed changes from the ERA5 reanalysis tend to confirm the “t-bone” areas of increase. Zonal wind speed changes from the ERA5 reanalysis diverge from models in areas of intense decreases of zonal wind speed.
Both ERA5 and RAOB data contradict modeled response by exhibiting areas of decreasing humidity.
The ERA5 reanalysis indicates very significant differences in the change of cloud cover from those modeled. Because cloud cover is by far the largest factor governing the amount of sunshine reflected by earth, this discrepancy introduces a large uncertainty in the ability of the models to predict earth’s radiative energy balance.
Climate Changes of the Twenty-First Century

In climate terms, the twenty-first century remains a relatively brief period. The major modeled features for this period are largely the same as for the longer previous periods (as well as for the future period of 2021 through 2100).
The cooling stratosphere, the warming troposphere and Arctic maxima all tend to be confirmed by the four data sets. In addition, the Hot Spot for this period appears to be qualitatively supported by the ERA5 and RAOB data. In contrast, both the RSS and UAH satellite data still appear to contradict the Hot Spot for this brief period.
The ERA5 is consistent with the “t-bone” zonal wind speed maxima. The ERA5 data contradicts the model with areas of increased zonal wind speed over the equator and over the Arctic.
Both ERA5 and RAOB contradict the models by indicating areas of decreasing humidity.
ERA5 data indicates large areas of cloud fraction change discrepancies.
Discussion
Which aspects of climate are predictable and which are not? Those studying meteorology confront the mathematical unpredictability of waves in the atmosphere. While this unpredictability remains within climate models, it appears that some aspects of climate change from increased carbon dioxide are predictable because radiative forcing occurs within a context of relative constancy of the unchanging climate factors. These factors include geography, gravity, earth rotation and orbit. While wave patterns in the jet streams can and will fluctuate, regardless of carbon dioxide levels, it is the spheroidal shape and rotation of earth which determine that there will be jet streams.
Stratospheric temperature decrease is implied by radiative transfer models alone. This feature persists when subjected to the motions of general circulation models. The effect of motions may be positive, negative, or of little change and the motion predictions may be in error. But this feature, which has been predicted by radiative transfer models since before the RAOB record was sufficiently long enough for analysis, appears predictable.
Tropospheric temperature increase is also implied by static atmosphere radiative transfer models alone. This is, of course, the major climate change predicted - global warming of the troposphere, and categorically, tropospheric temperature increase appears predictable.
The lower tropospheric Arctic maxima of temperature increase is partly implied by radiative forcing alone in that the strong temperature inversions of the polar regions impose greater radiative forcing which is amplified by additional carbon dioxide. There is also a dynamic consideration of this feature in that a spheroidal earth imposes the energy gradient between the poles and tropics which causes advective exchange. Increased sensible and latent heat in the lower levels of the troposphere imply increased sensible and latent heat arriving at the Arctic, even for a constant rate of atmospheric mass exchange.
The hot spot maxima of increased temperature would also appear to be implied by increased convective transport of sensible and latent heat, even for a constant volume of atmospheric mass exchanged. The absence of the hot spot feature in the RAOB and MSU era analyses and the presence of the hot spot feature in the twenty-first century trends bear watching. The temperature increases over the Arctic and Northern Hemisphere more generally, are greater than modeled. It could be that heat modeled to cause the hot spot has instead arrived at the Arctic. Also, the twenty-first century so far may have experienced a trend of anomalously high amounts of absorbed sunshine.
The t-bone shaped features of increased zonal wind speed modeled to occur with global warming would appear to be increases in the speed of the jet streams located in the mean at approximately the same locations. If so, these features are interesting in that they would appear to contradict the concept of a weaker Northern jet stream resulting from the maxima of temperature increase in the Arctic. An increase of the zonal wind speeds is, however, consistent with a hot spot maxima of temperature increase, because the hot spot would tend to increase the pole to equator gradients in each hemisphere. However, as noted, the hot spot is not exhibited in the trends of the RAOB or MSU eras.
Humidity is notoriously difficult to measure. Some amount of the decreasing trends over the RAOB era have been attributed to instrumentation changes. However, some areas of decreasing humidity are still evident, even for the recent years of the twenty-first century, when fewer instrumentation changes have occurred. Across the different eras, there is an increase of humidity at the lowest levels around 900 mb. Also, the polar regions exhibit increases of humidity larger than is modeled. If the humidity assessments are accurate, they may indicate somewhat more efficient emission of energy to space because a pattern of decreased upper level humidity over increased lower level humidity implies more energy leaving earth from a higher temperature.
Finally, the changes of cloud cover are not particularly well measured. Clouds can have very brief lifetimes of changing morphology and constituency. The discrepancies between the model and reanalysis of cloud cover changes mean that both cannot be accurate, and that we cannot preclude both from being inaccurate. Because cloud cover largely determines the amount of solar energy earth absorbs, we do not know how much of earth energy balance is determined by greenhouse gas forcing in comparison to perhaps natural fluctuation of cloud cover.
References
Syukuro Manabe (2019), "Role of greenhouse gas in climate change", Tellus A: Dynamic Meteorology and Oceanography, 71:1, https://doi.org/10.1080/16000870.2019.1620078
J. Hansen, M. Sato, R. Ruedy, P. Kharecha, A. Lacis, R. Miller, L. Nazarenko, K. Lo, G. A. Schmidt, G. Russell, I. Aleinov, S. Bauer, E. Baum, B. Cairns, V. Canuto, M. Chandler, Y. Cheng, A. Cohen, A. Del Genio, G. Faluvegi, E. Fleming, A. Friend, T. Hall, C. Jackman, J. Jonas, M. Kelley, N. Y. Kiang, D. Koch, G. Labow, J. Lerner, S. Menon, T. Novakov, V. Oinas, Ja. Perlwitz, Ju. Perlwitz, D. Rind, A. Romanou, R. Schmunk, D. Shindell, P. Stone, S. Sun, D. Streets, N. Tausnev, D. Thresher, N. Unger, M. Yao, and S. Zhang, "Dangerous human-made interference with climate: A GISS modelE study", Atmos. Chem. Phys. 7,9 (07 May 2007): 2287-2312 https://doi.org/10.5194/acp-7-2287-2007
Hersbach, Hans & Bell, Bill & Berrisford, Paul & Hirahara, Shoji & Horányi, András & Muñoz Sabater, Joaquín & Nicolas, Julien & Peubey, Carole & Radu, Raluca & Schepers, Dinand & Simmons, Adrian & Soci, Cornel & Abdalla, Saleh & Abellan, Xavier & Balsamo, Gianpaolo & Bechtold, Peter & Biavati, Gionata & Bidlot, Jean & Bonavita, Massimo & Thépaut, J.-N. (2020). The ERA5 global reanalysis. Quarterly Journal of the Royal Meteorological Society. https://doi.org/10.1002/qj.3803.
Copernicus Climate Change Service (C3S) (2017): ERA5: Fifth generation of ECMWF atmospheric reanalyses of the global climate, Copernicus Climate Change Service Climate Data Store (CDS), accessed January 6, 2021, https://cds.climate.copernicus.eu/cdsapp#!/home.
Imke Durre, National Centers for Environmental Information (NCEI), Integrated Global Radiosonde Archive V2, https://www1.ncdc.noaa.gov/pub/data/igra/igra2-dataset-description.docx. Data accessed Jan 14, 2021, https://www1.ncdc.noaa.gov/pub/data/igra/monthly/monthly-por/.
Roy Spencer, John Christy, and William Braswell, "UAH Version 6 global satellite temperature products: Methodology and results," Asia-Pacific J Atmos Sci 53, 1, (February 2017): 121-130, doi:10.1007/s13143-017-0010-y.
UAH MSU data accessed February 15, 2021 from: https://www.nsstc.uah.edu/data/msu/v6.0/.
Carl A. Mears and Frank J. Wentz, "A Satellite-Derived Lower-Tropospheric Atmospheric Temperature Dataset Using an Optimized Adjustment for Diurnal Effects," J. Climate 30, 19 (October 1, 2017): 7695-7718, doi:10.1175/JCLI-D-16-0768.1.
RSS MSU data accessed February 15, 2021 from: http://data.remss.com/msu/data/uah_compatible_format/.
Kevin E. Trenberth, John T. Fasullo, and Jeffrey Kiehl, "Earth's global energy budget," Bull. Amer. Meteorol. Soc. 90, 3 (March 1, 2009): 314, doi:10.1175/2008BAMS2634.1.


