


Introduction
While reading about climate change and global warming, I was unclear about certain aspects of radiative forcing and the ‘greenhouse effect’. I performed the following analyses, the results of which may be of interest.
Summary
For a hypothetical atmosphere of identical constituents, radiative response converges to the same temperature profile, regardless of the initial temperature profile.
The resulting temperature profile implies convective motion.
The implied convective transfers appear to lead to further convergence toward the reanalyzed temperature profile.
Calculation of radiative imbalance at the tropopause exhibits a logarithmic response curve for changes of the major greenhouse gas, carbon dioxide.
Such curves do vary somewhat depending upon atmospheric profiles, but approximate nominal values.
By inverting the Stefan-Boltzmann equation ( e = σ T⁴ ) on outgoing longwave radiation, the seasonal response of global mean monthly surface temperature and hypothetical emissive temperature exhibits the greenhouse effect.
1. Time Marching Experiment
Manabe and Strickler (1964) demonstrated what pure radiative equilibrium in an idealized atmosphere might be. In this experiment, the authors applied radiative transfer on identical atmospheric profiles. The profiles had the same distributions of clouds, humidity, carbon dioxide, methane, nitrous oxide, CFCs, and surface characteristics. The temperature profiles were then set to two different profiles, one isothermal around +100°C, the other isothermal around -100°C. Iteratively applying the resulting heating rate from radiative transfer process alone led these two profiles to converge to the same result. The steps of this process are shown below in Figure 1a from that paper.
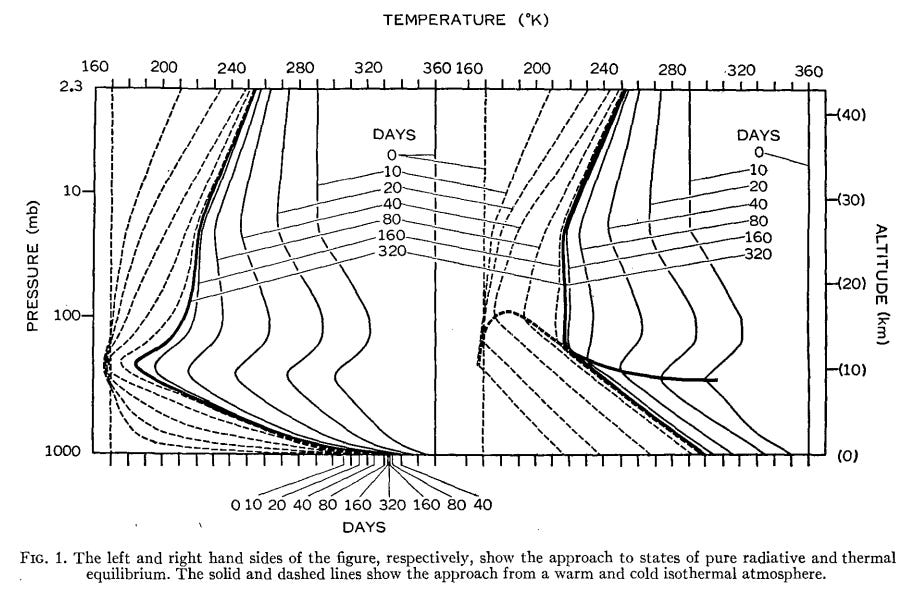
Since 1964, numerous modeling efforts have ensued. One such effort resulted in the Column Radiation Model (CRM) which represents the radiation portion of the legacy NCAR Community Climate Model 3. The CRM is an older but serviceable radiation code which I have implemented to mimic this one aspect of the pioneering efforts of Manabe and Strickler. The results appear in the animated Figure 1b below.
In the animation, one can see the effects of radiative heating on the cold isothermal atmosphere and the effects of radiative cooling on the hot isothermal atmosphere. That the temperature profiles tend to converge, regardless of starting temperature, is evidence of how the ‘greenhouse effect’ determines a part of the resulting observed atmospheric temperature profile. An important remainder not described by radiative transfer alone is indicated in Figure 1c below.
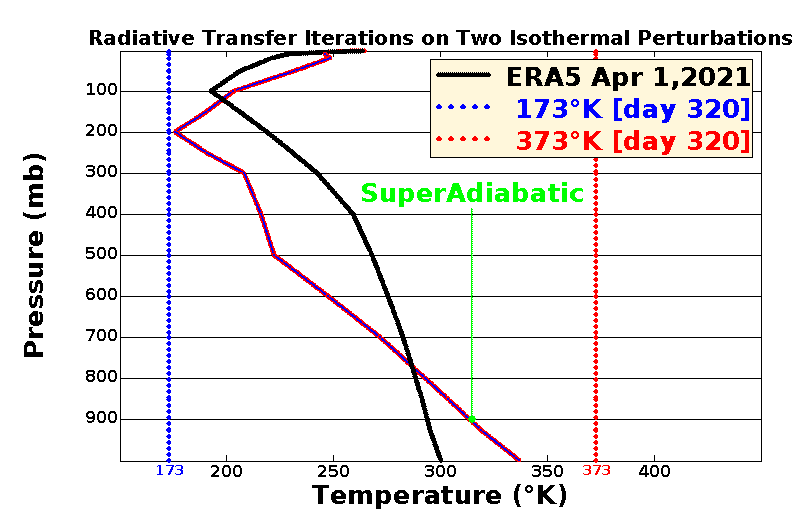
The resulting pure radiative temperature profile still differs significantly from the temperature profile of the reanalysis. The upper level temperatures of the pure radiative profile are significantly lower than those of reanalysis, while the lower level temperatures of the pure radiative profile are significantly higher than those of reanalysis. This difference results in the lapse rate ( that is, the rate of decrease of temperature with height ) being super-adiabatic. Such a lapse rate is auto-convective. Auto-convective means that the implied buoyancy is unstable and vertical motion will occur. This vertical motion has the effect of exchanging the heat surplus of the lower levels with the heat deficit of the upper levels which will theoretically result in a temperature profile closer to that of the reanalysis.
Manabe and Strickler applied a hypothetical convective adjustment to emulate such a process. In reality, atmospheric motions occur in three dimensions and some of the vertical exchange is a function of horizontal exchange. The necessity of applying motion transfers in four dimensions ( space and time ) to more accurately emulate the actual observed temperature profiles motivates the use of the general circulation models which we think of as the climate models.
2. The Simplified Forcing Expressions
The radiative forcing due to increased greenhouse gasses such as carbon dioxide are described as logarithmic. The “simplified expressions” of radiative forcing by greenhouse gasses appear in Table 6.2 of the IPPC Third Assessment Report. The IPPC notes the work of Myhre et. al. (1998) and Figure 2a below is from this paper.

In Figure 2b below, the results of analagous calculations using the Column Radiation Model are plotted over the same graph. There is some variation that occurs between vertical profiles, but the mean value appears to be close to the generalized value of radiative forcing for a carbon dioxide doubling.

3. Seasonal Radiative Response
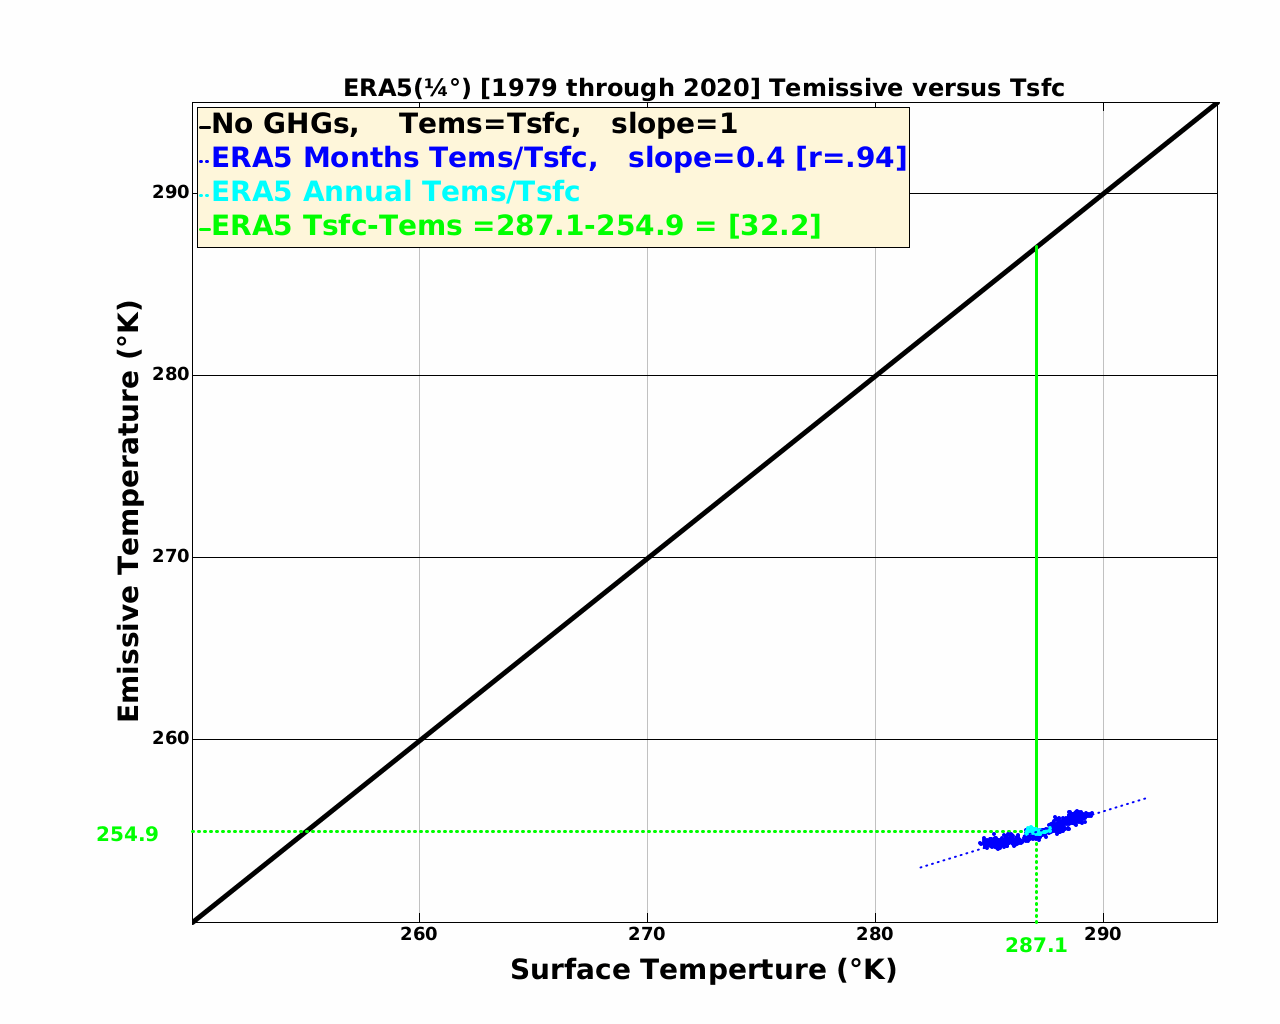
Figure 3 below contains emissive temperature versus surface temperature from reanalysis. The emissive temperature is derived by inverting the Stefan-Boltzmann equation on the outgoing longwave radiation. The Stefan-Boltzmann equation applies to so called black body radiation. In reality, radiation to space takes place from aerosols, clouds, greenhouse gasses. As such, the atmosphere radiates as a so called grey body rather than a black body.
The data are from the ECMWF Reanalysis 5 (ERA5). The monthly global means are plotted in blue while the annual global means are plotted in cyan. The solid black line of slope=1 represents the hypothetical condition wherein no greenhouse gasses existed and all the radiation that a hypothetical black body surface emitted reached space unencumbered.
The difference of emissive temperature between the black line and the reanalysis results represents the “greenhouse effect” which is referred to as the “atmospheric effect” owing to the effect of gasses ( and clouds as well as other aerosols ) in the atmosphere absorbing and emitting radiation to space. The derived global means of a surface temperature of 287°K and of an emissive temperature of 255°K are close to the nominal values.
The thin dotted blue line segment indicates a slope of the monthly data over the course of seasonal variation. A slope of one indicates no feedback. That is to say, the “greenhouse effect” would remain of constant absolute amount regardless of surface temperature. The slope of response is less than one ( around 0.4 ) which indicates that as surface temperature increases, the “greenhouse effect” also increase, indicating a positive feedback. This is, of course, for the seasonal response, not for the decadal temperature change induced through warming from greenhouse gas increases.
A usual caveat applies to this and all reanalysis. Reanalyses represent unmeasured and poorly measured areas of earth, are not strictly falsifiable and carry uncertainty.
Notes
Syukuro Manabe and Robert F. Strickler, "Thermal Equilibrium of the Atmosphere with a Convective Adjustment," J. Atmos. Sci. (July, 1964): 361-385, https://climate-dynamics.org/wp-content/uploads/2016/06/manabe64a.pdf
National Center for Atmospheric Research, “Column Radiation Model,” from the NCAR Community Climate Model 3, model description at: https://www.cgd.ucar.edu/cms/ccm3/TN-420/, model code downloaded from: http://geosci.uchicago.edu/~rtp1/PrinciplesPlanetaryClimate/Courseware/PlanetaryClimateCourseware/CliMT-master/src/radiation/ccm3/ignore/crm-2.1.2-ccm-3.6/doc/index.shtml
Gunnar Myhre, Eleanor J. Highwood, Keith P. Shine and Frode Stordal, “New estimates of radiative forcing due to well mixed greenhouse gases,” Geophysical Research Letters 25, 14, (1998): 2715-2718, https://doi.org/10.1029/98GL01908
Intergovernmental Panel on Climate Change (IPCC), “TAR Climate Change 2001: The Scientific Basis”, table 6.2, p358, https://www.ipcc.ch/site/assets/uploads/2018/03/TAR-06.pdf#page=10
Hersbach, Hans & Bell, Bill & Berrisford, Paul & Hirahara, Shoji & Horányi, András & Muñoz Sabater, Joaquín & Nicolas, Julien & Peubey, Carole & Radu, Raluca & Schepers, Dinand & Simmons, Adrian & Soci, Cornel & Abdalla, Saleh & Abellan, Xavier & Balsamo, Gianpaolo & Bechtold, Peter & Biavati, Gionata & Bidlot, Jean & Bonavita, Massimo & Thépaut, J.-N. (2020). "The ERA5 global reanalysis." Quarterly Journal of the Royal Meteorological Society. https://doi.org/10.1002/qj.3803.
Copernicus Climate Change Service (C3S) (2017): ERA5: Fifth generation of ECMWF atmospheric reanalyses of the global climate, Copernicus Climate Change Service Climate Data Store (CDS), accessed January, 2021, https://cds.climate.copernicus.eu/cdsapp#!/home.