
Hurricane Intensity

With a new North Atlantic hurricane season underway, I’ve taken a fresh look at some correlations of tropical cyclone intensity ( of storms reaching hurricane strength in particular ). The cyclone data comes from IBTRACS. The weekly Sea Surface Temperature data is from OISST. Figure 1a below depicts the tracks of all tropical cyclones reaching hurricane wind speed for the maximal period of record for both data sets.
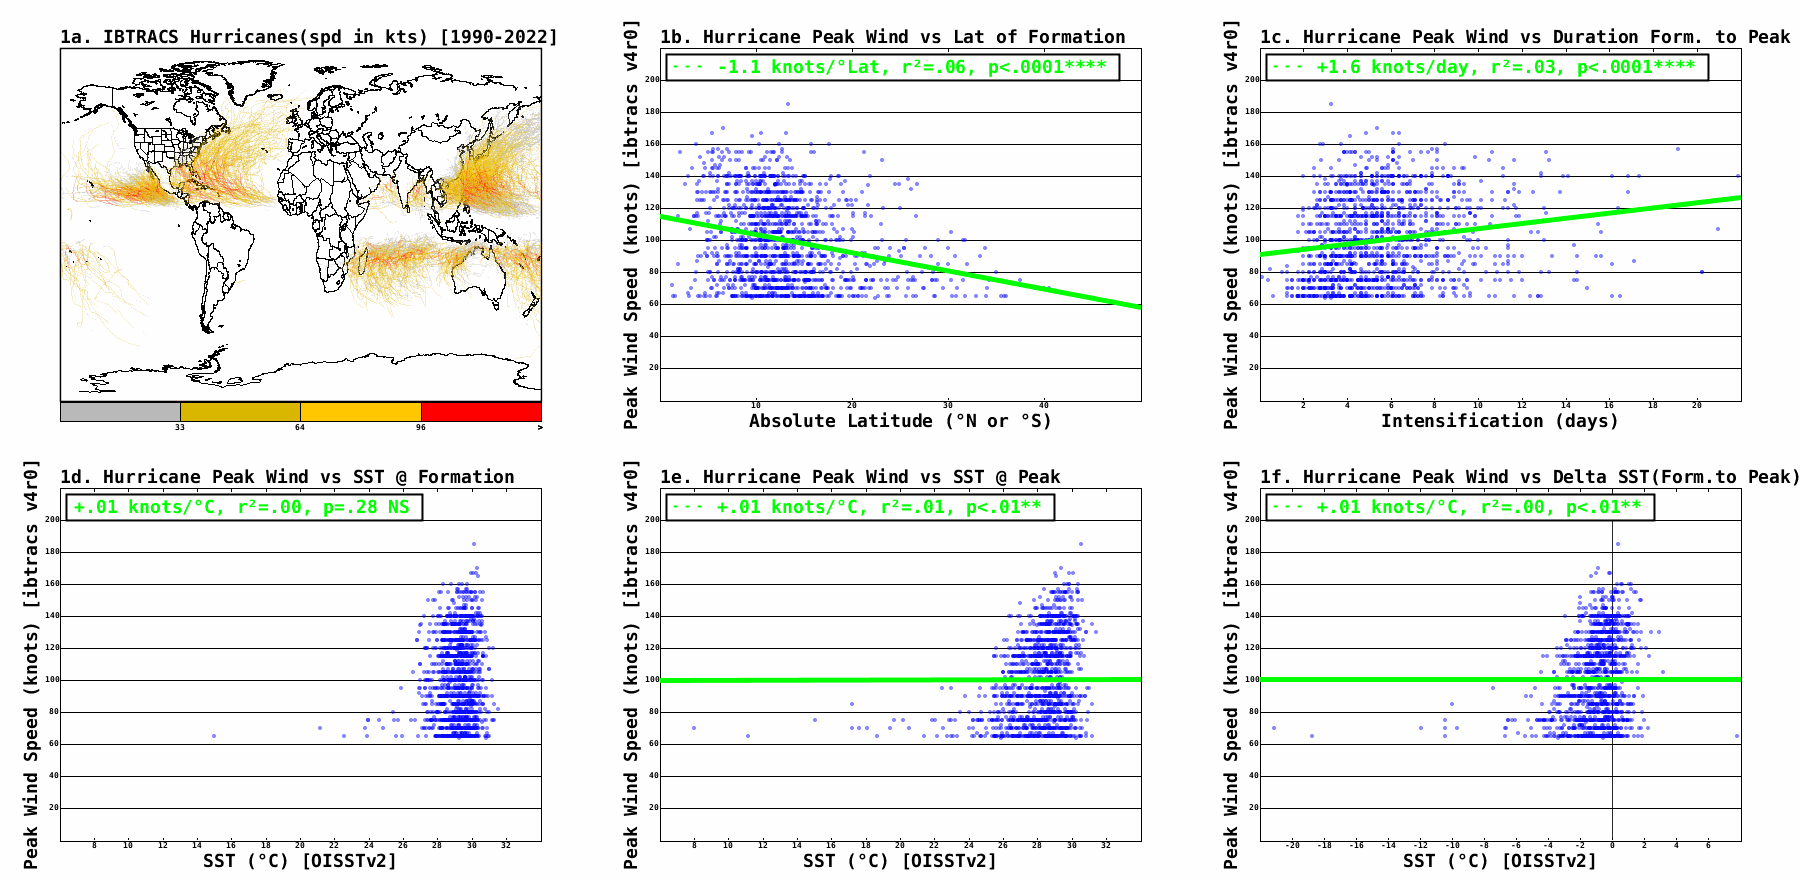
Figure 1b. represents the anti-correlation of peak wind speed versus the absolute latitude ( North or South ) at which the tropical cyclone first formed. The effect size is relatively large. The amount of variance explained, r², is relatively small. Tropical cyclones peak are progressively lower wind speeds the farther pole-ward that they originate, in part because they have less potential development time before they encounter the higher wind shear of high latitudes. This appears to be the case in Figure 1c which indicates the weak correlation of peak wind speed with duration between formation and the time of peak wind speed.
Figure 1d is a plot of peak wind speed versus the sea surface temperature at the point of storm formation, for the week prior to the day of storm formation. Using the prior week limits the effect that a storm may have on a given week’s average sea surface temperature. There is no significant correlation between strength and the temperature at the formation location.
Figure 1e is a plot of peak wind speed versus the sea surface temperature at the point of peak wind speed, for the week prior. There is a correlation between strength at peak and the temperature at the point of peak. However, the effect size is very small and the amount of variance explained is close to zero.
Figure 1f is a plot of peak wind speed versus the change of sea surface temperature from the point of formation to the point of peak. The effect size is very small and the amount of variance explained is close to zero.