Analysis of "Clouds and the Earth's Radiant Energy System (CERES)" data
CERES means and trends through 2020
Myriad uncertainties may exist
Negative incoming shortwave trend [-0.4 W/m2 per century]
Positive absorbed shortwave trend [+6.7 W/m2per century] for nearly all latitudes
Positive outgoing longwave trend [global +2.8 W/m2 per century] for nearly all latitudes
Positive net radiation trend [+3.8 W/m2 per century] for nearly all latitudes
Cloud area fraction appears increased in the tropics, decreased elsewhere
Cloud optical depth appears increased at the poles, decreased most elsewhere
Cloud pressure appears to have decreased over most of the Northern Hemisphere, increased over the Arctic and little changed elsewhere
Cloud temperature appears to have mixed changes
Introduction
The previous post, Earth Radiance Trends, exhibited climate models, reanalysis, and CERES observations in context. The radiance is largely a function of clouds. The pertinent CERES cloud data and radiance are the subject of this post. The CERES data are from orbiting satellites. Such remote sensing is from differing angles of observation, from a platform that varies in altitude, with sensors that degrade or drift. Many other factors mean numerous uncertainties may exist. With those uncertainties in mind, below are graphical results to analyses of CERES data in terms of spatial and temporal means as well as spatial trends.
Incoming ShortWave Radiation
Figure 1. Incoming shortwave radiation. Earth’s oblate spheroidal shape is largely responsible for the polar minima and the equatorial maxima apparent in 1a and 1b. Earth’s elliptical orbit around the sun produces the pattern of incoming shortwave which peaks in January and troughs in July. The trend of incoming solar is small as show in 1e and 1f.
Reflected ShortWave Radiation
Figure 2. Reflected shortwave radiation. The period of record mean reflected solar radiation of 2a exhibits broad maxima over the snow covered Greenland and Antarctica as well as over low latitude land masses. Questionable very high maxima also appear over Peru, the Sahara, and China. The areas of minimal solar reflection are broad areas of low latitude oceans, areas which are marked by recurrent subsidence and consequent fair skies which allow penetration of the absorptive oceans below. Interestingly, the absolute amount of reflected shortwave radiation in 2b remains relatively constant with latitude. A trend of decreasing reflected solar radiation is evident in 2c, 2e, and 2f.
Absorbed ShortWave Radiation
Figure 3. Absorbed shortwave radiation. Subtracting the reflected shortwave radiation of Figure 2 from the incoming shortwave radiation of Figure 1 results in the resulting Absorbed Shortwave Radiation. Absorbed solar is lowest over Antarctica, the high Arctic and Greenland. The trend of absorbed solar radiation of 3e indicates a relatively large 6.7 W/m2 per century. The trend is highest for the high Arctic, but the trend is positive for nearly all latitudes as indicated by 3f.
Outgoing LongWave Radiation
Figure 4. Outgoing longwave radiation. The sub-tropical areas of clear skies emit the greatest amount of longwave radiation to space as seen in 4a. The cold snow and ice surfaces of Greenland and Antarctica emit the least amount of longwave infrared radiation. The increasing trend of outgoing longwave seen in 4c appears to occur at nearly all latitudes in 4f.
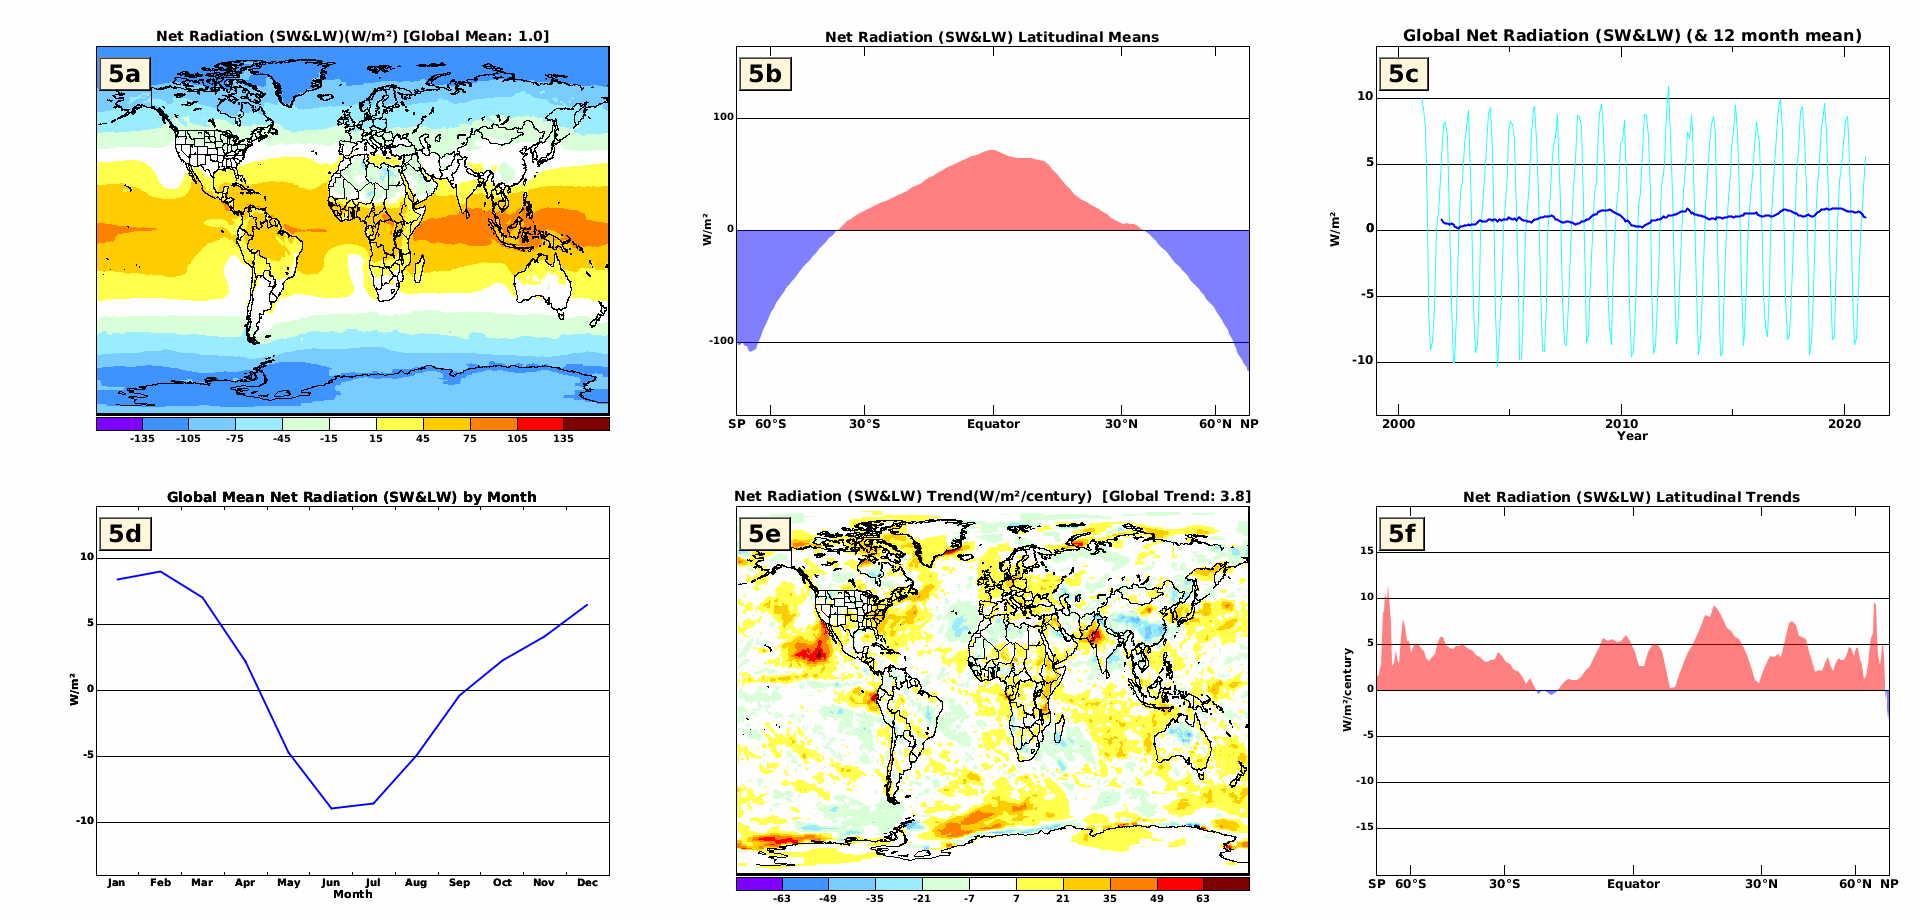
Net of Absorbed SW & Outgoing LW Radiation
Figure 5. Net radiation. Subtracting the outgoing longwave radiation from the absorbed radiation yields the net radiation. The annual mean gradient of net radiation from poles to equator is seen in 5a and 5b. This gradient causes an ensuing gradient of temperature which also implies a gradient of pressure. Waves in this pressure gradient occur which result in variations of weather. Over the course of the CERES observations, there is a trend of increasing net radiation as seen in 5c. This trend occurs at nearly all latitudes as seen in 5f.
Cloud Area Fraction
Figure 6. Cloud area fraction. Clouds are the largest global determinant of reflected sunshine. The cloud area fraction from CERES indicates that the cloudiest area is the Southern Ocean off the coast of Antarctica. This area exhibits katabatic winds from cold air masses cascading off the high Antarctic interior. This is a reminder of the importance of dynamics more than temperature to atmospheric phenomena. The most cloud free areas are associated with the subsidence over the Sonoran Desert, the Sahara Desert, Southern Africa and Australia as well as the subtropical oceans. There is variability in the record, but the global trend is small. The bandwise trends of 6f, however, indicate decreased cloud area in the extra-tropics but with increased cloud area in the tropics.
Cloud Optical Depth
Figure 7. Cloud optical depth. The CERES data also includes Cloud Optical Depth, which is an estimate of the vertical cloud density. According to the CERES data, are thickest around the poles and thinnest near the equator as shown in 7b. Figure 7f indicates that the trend has been toward thicker clouds at the poles and thinner clouds at lower latitudes.
Cloud Effective Pressure
Figure 8. Cloud effective pressure. Lower pressure corresponds to greater geometric height. Clouds effective pressure trends indicate lower clouds over the high Arctic, higher clouds over the Northern extratropics and lesser change elsewhere.
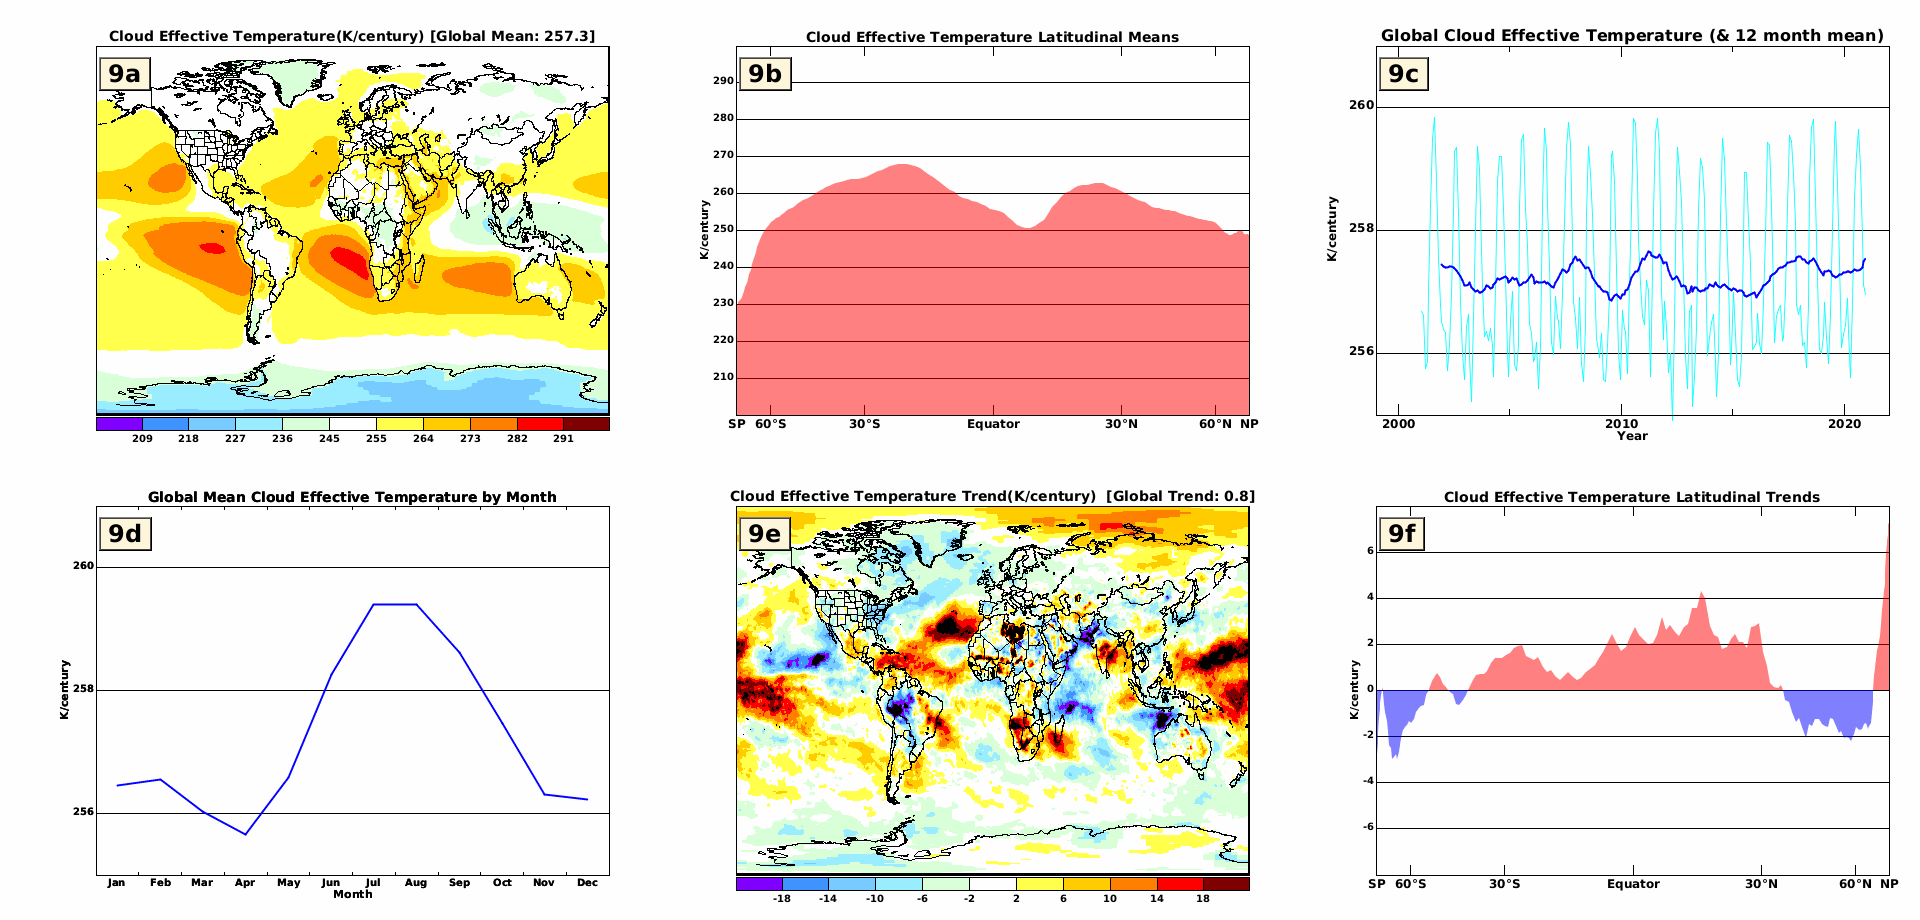
Cloud Effective Temperature
Figure 9. Cloud effective temperature. This temperature can represent changes in the height of cloud tops ( higher tops are typically cooler ). This temperature can also represent local temperature change at the give cloud top level. The distribution of cloud temperature change is shown in 9f.