

2022: Past Climate Change Predictions
In 1983, Nobel laureate Syukuro Manabe made these remarkable qualitative predictions about climate change from carbon dioxide

Syukuro Manabe is known as the godfather of climate modeling for his remarkable pioneering work in the field. Part of that history includes a study found in Advances in Geophysics, Volume 25. In this study, professor Manabe identified eight qualitative climate changes modeled to occur due to increased carbon dioxide. These predictions were made before longer term trends were apparent in the brief and limited observations of the time. Indeed, in that 1983 study, professor Manabe noted that modeled climate changes had not yet been observed. Figures below represent comparisons of these succinct predictions with observations. These figures are for the period 1979 through 2021, described in the notes below.
Stratosphere Cools And Troposphere Warms
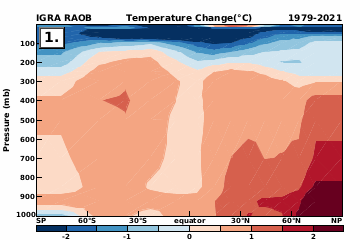
Figure 1 is a plot of balloon based temperature changes. The blue shadings near the top of Figure 1 and the red shadings at lower levels indicate trends broadly consistent with this prediction.
Warming Greater At High Latitudes Than at Low Latitudes

Figure 2 is a bar chart of surface temperature changes by latitude band. Arctic surface temperature changes are consistent with this qualitative prediction. Antarctic surface temperatures, however, indicate a slight decrease.
Maximal Arctic Warming During Winter, Little Seasonality Of Warming At Low Latitudes

Figure 3 depicts observed surface temperature changes by month. There is a peculiar “cat ear” pattern with peaks during April and November. Apart from these peaks, the winter warming does appear to be slightly larger than the summer warming while the low latitude warming is more nearly constant throughout the year.
Global Mean Precipitation and Evaporation Increase

Figure 4 exhibits considerable divergence of four global precipitation estimates. A paper by Sun et. al. similarly found large uncertainties, discrepancies and variability among precipitation data sets. Global evaporation is even less well measured and probably more uncertain than are estimates of global precipitation. Unfortunately, it appears that these predictions are not testable due to observational insufficiency.
Polar Sea Ice Area And Thickness Decrease
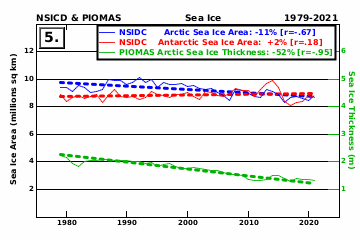
In Figure 5, the Arctic sea ice area change indicates a decrease of 11%, consistent with prediction. The change of Arctic sea ice thickness indicates a decrease of 52%, also consistent with prediction. However, the Antarctic sea ice area change indicates a small increase of 2%.
Snowmelt Season Arrives Earlier

Figure 6 contains plots of Northern Hemisphere snow cover. The dashed blue line represents weekly mean snow cover for the first half of the period. The solid red line represents weekly mean snow cover for the second half of the period. The data are smoothed. Also, the estimates of snow cover area do not distinguish between snowfall and snow melt. According to this analysis, the week of maximum of snow cover remained at week four. The week of minimum snow cover occurs one week earlier during the second half period. Snow cover area appears to have decreased during Spring, but also appears to have increased during Autumn.
Runoff Increases At High Latitudes
Uncertainty about runoff is compounded by the uncertainties of the variables on which it depends, including precipitation, evaporation, soil types and soil moisture. As with precipitation, runoff would appear to be insufficiently measured to assess this modeled feature.
During Summers, Soil Moisture Decreases At Northern Middle And High Latitudes
Unfortunately, soil moisture is also dependent on the insufficiently measured precipitation and evaporation. These shortcomings, combined with poor characterization of soils and vegetation, led professor Manabe to write in his recent book Beyond Global Warming, that comparisons of observed soil moisture with modeled soil moisture were not yet possible.
Consistent Observations
It is not possible to assess theories of climate change due to increased carbon dioxide through strictly controlled, randomized, blinded experiments. Instead, evidence to assess such theories is constrained to the weaker observational studies, where n=1. Such observational studies cannot preclude other causal factors. Still, the observational results indicate some consistencies with theory and some discrepancies.
Stratospheric cooling and tropospheric warming are consistent with radiative forcing from increased carbon dioxide. The chaotic motions of the atmosphere tend to decrease at the tropopause and to approach zero at the hypothetical top of the atmosphere. Hence, radiative forcing becomes more significant with height since radiance becomes the only remaining means of energy transfer. Of course, other factors are not precluded, but the direct effect of radiative forcing predicts the observed stratospheric cooling and tropospheric warming.
Arctic amplification is another consistent prediction from the early climate models.
At Least Partially Inconsistent Observations
The increase of Antarctic sea ice and the cooling trend around Antarctica represent relatively small changes. In 2019, Dr. Manabe wrote that these changes may be due to increased heat uptake in the Southern Ocean. The temperature profile of the Southern Ocean is close to isothermal, making it of low stability, and so, a source of vertical mixing. Perhaps another factor is that large areas of Antarctic land surface are three or four thousand meters above sea level. For these elevations, the mass above the tropopause may exceed the mass within the troposphere. In this case, the magnitude of radiatively cooled stratospheric air intruding into the troposphere may increase.
Increased maximum Northern Hemisphere snow cover area as well as the increased autumnal Northern Hemisphere snow cover area appear to be somewhat at odds with a warmer atmosphere. Though not explicitly identified, later and lesser snow accumulation would appear to be subject to the warming troposphere by the same considerations of earlier and greater snow melt. Of course, the precipitation trends may be a factor confounding the effects of temperature.
Notes
Copernicus Climate Change Service (C3S) (2017): ERA5: Fifth generation of ECMWF atmospheric reanalyses of the global climate, Copernicus Climate Change Service Climate Data Store (CDS), accessed May 6, 2020, https://cds.climate.copernicus.eu/cdsapp#!/home.
Imke Durre, National Centers for Environmental Information (NCEI), Integrated Global Radiosonde Archive V2, https://www1.ncdc.noaa.gov/pub/data/igra/igra2-dataset-description.docx.
F. Fetterer, K. Knowles, W. N. Meier, M. Savoie, and A. K. Windnagel. 2017, updated daily. Sea Ice Index, Version 3. Monthly NH and SH Sea Ice Area, Boulder, Colorado USA. NSIDC: National Snow and Ice Data Center. https://doi.org/10.7265/N5K072F8
Data accessed from:
ftp://sidads.colorado.edu/DATASETS/NOAA/G02135/seaice_analysis/Sea_Ice_Index_Monthly_Data_by_Year_G02135_v3.0.xlsx,
on August 10, 2020.
J. Hansen, M. Sato, R. Ruedy, P. Kharecha, A. Lacis, R. Miller, L. Nazarenko, K. Lo, G. A. Schmidt, G. Russell, I. Aleinov, S. Bauer, E. Baum, B. Cairns, V. Canuto, M. Chandler, Y. Cheng, A. Cohen, A. Del Genio, G. Faluvegi, E. Fleming, A. Friend, T. Hall, C. Jackman, J. Jonas, M. Kelley, N. Y. Kiang, D. Koch, G. Labow, J. Lerner, S. Menon, T. Novakov, V. Oinas, Ja. Perlwitz, Ju. Perlwitz, D. Rind, A. Romanou, R. Schmunk, D. Shindell, P. Stone, S. Sun, D. Streets, N. Tausnev, D. Thresher, N. Unger, M. Yao, and S. Zhang, "Dangerous human-made interference with climate: A GISS modelE study", Atmos. Chem. Phys. 7,9 (07 May 2007): 2287-2312 https://doi.org/10.5194/acp-7-2287-2007
Syukuro Manabe and Anthony J. Broccoli, Beyond Global Warming, p160, (Princeton and Oxford: Princeton University Press, 2020). https://www.amazon.com/Beyond-Global-Warming-Numerical-Revealed/dp/0691183716
Syukuro Manabe (2019), "Role of greenhouse gas in climate change", Tellus A: Dynamic Meteorology and Oceanography, 71:1, https://doi.org/10.1080/16000870.2019.1620078
Barry Saltzman(editor), "Carbon Dioxide And Climate Change", Theory of Climate [Advances in Geophysics, Vol. 25], (New York: Academic Press, 1983), p39-82, https://www.elsevier.com/books/advances-in-geophysics/saltzman/978-0-12-018825-3.
B. J. Soden and I. M. Held, 2006: "An Assessment of Climate Feedbacks in Coupled Ocean–Atmosphere Models". J. Climate, 19, 3354–3360, https://doi.org/10.1175/JCLI3799.1.
Q. Sun, C. Miao, Q. Duan, H. Ashouri, S. Sorooshian, and K.‐L. Hsu, (2018). "A review of global precipitation data sets: Data sources, estimation, and intercomparisons." Reviews of Geophysics, 56, 79– 107. https://doi.org/10.1002/2017RG000574
Figure 1, Radiosonde Temperature.
Monthly, 0Z IGRA radiosonde temperature data from: https://www1.ncdc.noaa.gov/pub/data/igra/monthly/monthly-por/temp_00z-mly.txt.zip. The analysis includes only data from stations which are more than 90% complete. The figure depicts shaded band averages of changes determined by ordinary least squares regression.
Figure 2, Surface Temperature Bands.
Changes calculated from the ordinary least squares regression of the NOAA Global Surface Temperature Index:
https://www.ncei.noaa.gov/data/noaa-global-surface-temperature/v5/access/timeseries/
Figure 3, Surface Temperature Seasonality.
Monthly changes calculated from the ordinary least squares regression of the NOAA Global Surface Temperature Index:
https://www.ncei.noaa.gov/data/noaa-global-surface-temperature/v5/access/timeseries/
Figure 4, Global Precipitation.
Climate Prediction Center Merged Analysis of Precipitation.
Xie, P., and P.A. Arkin, 1997: "Global precipitation: A 17-year monthly analysis based on gauge observations, satellite estimates, and numerical model outputs." Bull. Amer. Meteor. Soc., 78, 2539 - 2558.
CMAP Precipitation data provided by the NOAA/OAR/ESRL PSL, Boulder, Colorado, USA, from https://psl.noaa.gov, data from ftp://ftp.cdc.noaa.gov/Datasets/cmap/std.
GPCP, NOAA's Global Precipitation Climatology Project. R.F. Adler, G.J. Huffman, A. Chang, R. Ferraro, P. Xie, J. Janowiak, B. Rudolf, U. Schneider, S. Curtis, D. Bolvin, A. Gruber, J. Susskind, and P. Arkin, 2003: "The Version 2 Global Precipitation Climatology Project (GPCP) Monthly Precipitation Analysis (1979-Present)". J. Hydrometeor., 4,1147-1167. Data from https://www.ncei.noaa.gov/data/global-precipitation-climatology-project-gpcp-monthly/access/.
PREC, NOAA's PRECipitation REConstruction Dataset. PREC Precipitation data provided by the NOAA/OAR/ESRL PSL, Boulder, Colorado, USA. Data from ftp://ftp.cdc.noaa.gov/Datasets/prec.
ERA5, monthly ECMWF Reanalysis of precipitation, Copernicus Climate Change Service (C3S) (2017): ERA5: Fifth generation of ECMWF atmospheric reanalyses of the global climate, Copernicus Climate Change Service Climate Data Store (CDS), accessed May 6, 2020, https://cds.climate.copernicus.eu/cdsapp#!/home
Figure 5, Sea Ice Area And Thickness.
F. Fetterer, K. Knowles, W. N. Meier, M. Savoie, and A. K. Windnagel. 2017, updated daily. Sea Ice Index, Version 3. Monthly NH and SH Sea Ice Area, Boulder, Colorado USA. NSIDC: National Snow and Ice Data Center. https://doi.org/10.7265/N5K072F8. Data accessed from: ftp://sidads.colorado.edu/DATASETS/NOAA/G02135/seaice_analysis/Sea_Ice_Index_Monthly_Data_by_Year_G02135_v3.0.xlsx.
A. Schweiger, R. Lindsay, J. Zhang, M. Steele, H. Stern, "Uncertainty in modeled arctic sea ice volume", J. Geophys. Res., https://doi.org/10.1029/2011JC007084
J.L. Zhang and D.A. Rothrock, “Modeling global sea ice with a thickness and enthalpy distribution model in generalized curvilinear coordinates“, Mon. Weather Rev., 131, 845-861, 2003
Figure 6, Weekly Snow Cover Changes.
David A. Robinson, Thomas W. Estilow, and NOAA CDR Program (2012): "NOAA Climate Data Record (CDR) of Northern Hemisphere (NH) Snow Cover Extent (SCE), Version 1". Weekly Snow Cover Extent. NOAA National Centers for Environmental Information. https://doi.org/10.7289/V5N014G9. Data accessed from: https://climate.rutgers.edu/snowcover/files/wkcov.nhland.txt.
The to and from estimates of snow cover are calculated by the by ordinary least squares regression trend for each week of the period added to the period mean. The result is smoothed by a 1-2-1 filter.
Runoff Reanalysis.
Copernicus Climate Change Service (C3S) (2017): ERA5: Fifth generation of ECMWF atmospheric reanalyses of the global climate, Copernicus Climate Change Service Climate Data Store (CDS), accessed May 6, 2020, https://cds.climate.copernicus.eu/cdsapp#!/home.
Soil Moisture Reanalysis.
Copernicus Climate Change Service (C3S) (2017): ERA5: Fifth generation of ECMWF atmospheric reanalyses of the global climate, Copernicus Climate Change Service Climate Data Store (CDS), accessed May 6, 2020, https://cds.climate.copernicus.eu/cdsapp#!/home.